

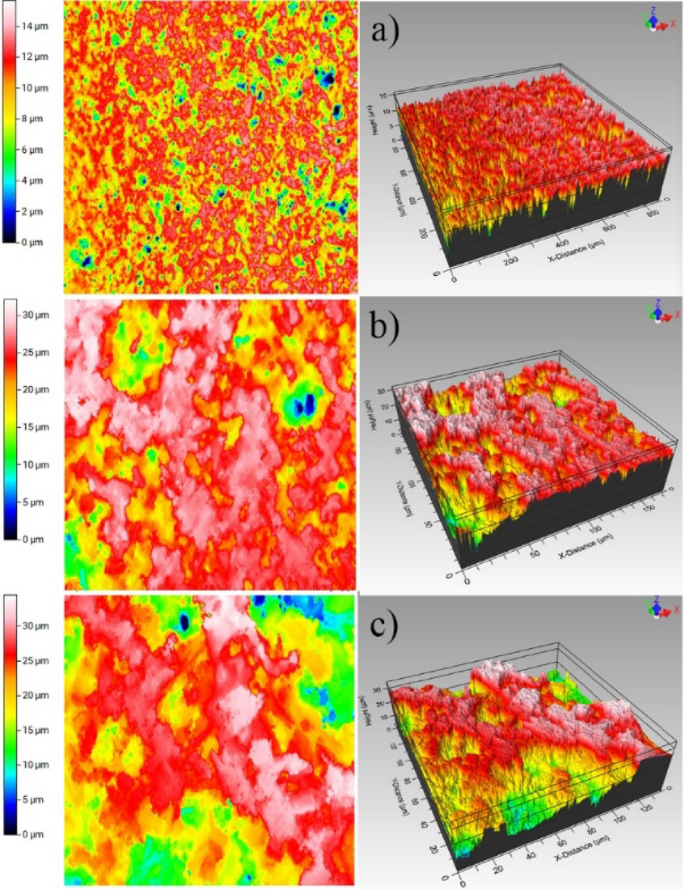
Surface roughness can change wear much more strongly than it changes friction. This note examines a ceramic-bead and alumina comparison in which TriboSolver supplied contact-pressure estimates for three surface finishes. It presents the reported pressures alongside measured friction and wear trends, explains why real contact area matters, and identifies the input information still needed for exact numerical reproduction. The article also separates this focused mechanical calculation from the paper’s wider experiments on cellulose suspensions and xanthan-gum solutions. Its central lesson is that contact modelling can provide useful mechanical context without directly predicting every observed wear track or lubricant effect. The distinction matters when assessing surface treatments.
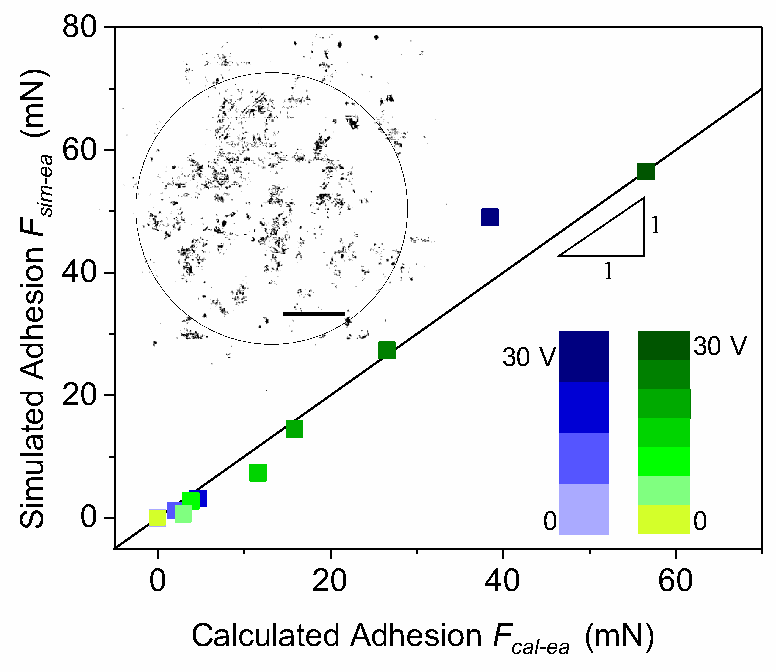
Electrical attraction between rough surfaces depends strongly on the smallest gaps around their contact patches. This note explains how a silicon-contact study combined a TriboSolver mechanical gap field with a separate dielectric model and friction measurements. It sets out the external and repulsive loading conventions, the fitted oxide thickness and the integration of electrical pressure over noncontact regions. Particular attention is given to the difference between force in millinewtons and pressure normalized over a microscopic area. The article also explains why the simple model cannot reproduce the observed polarity asymmetry and why the published experiment is not, by itself, verification of a current software release.
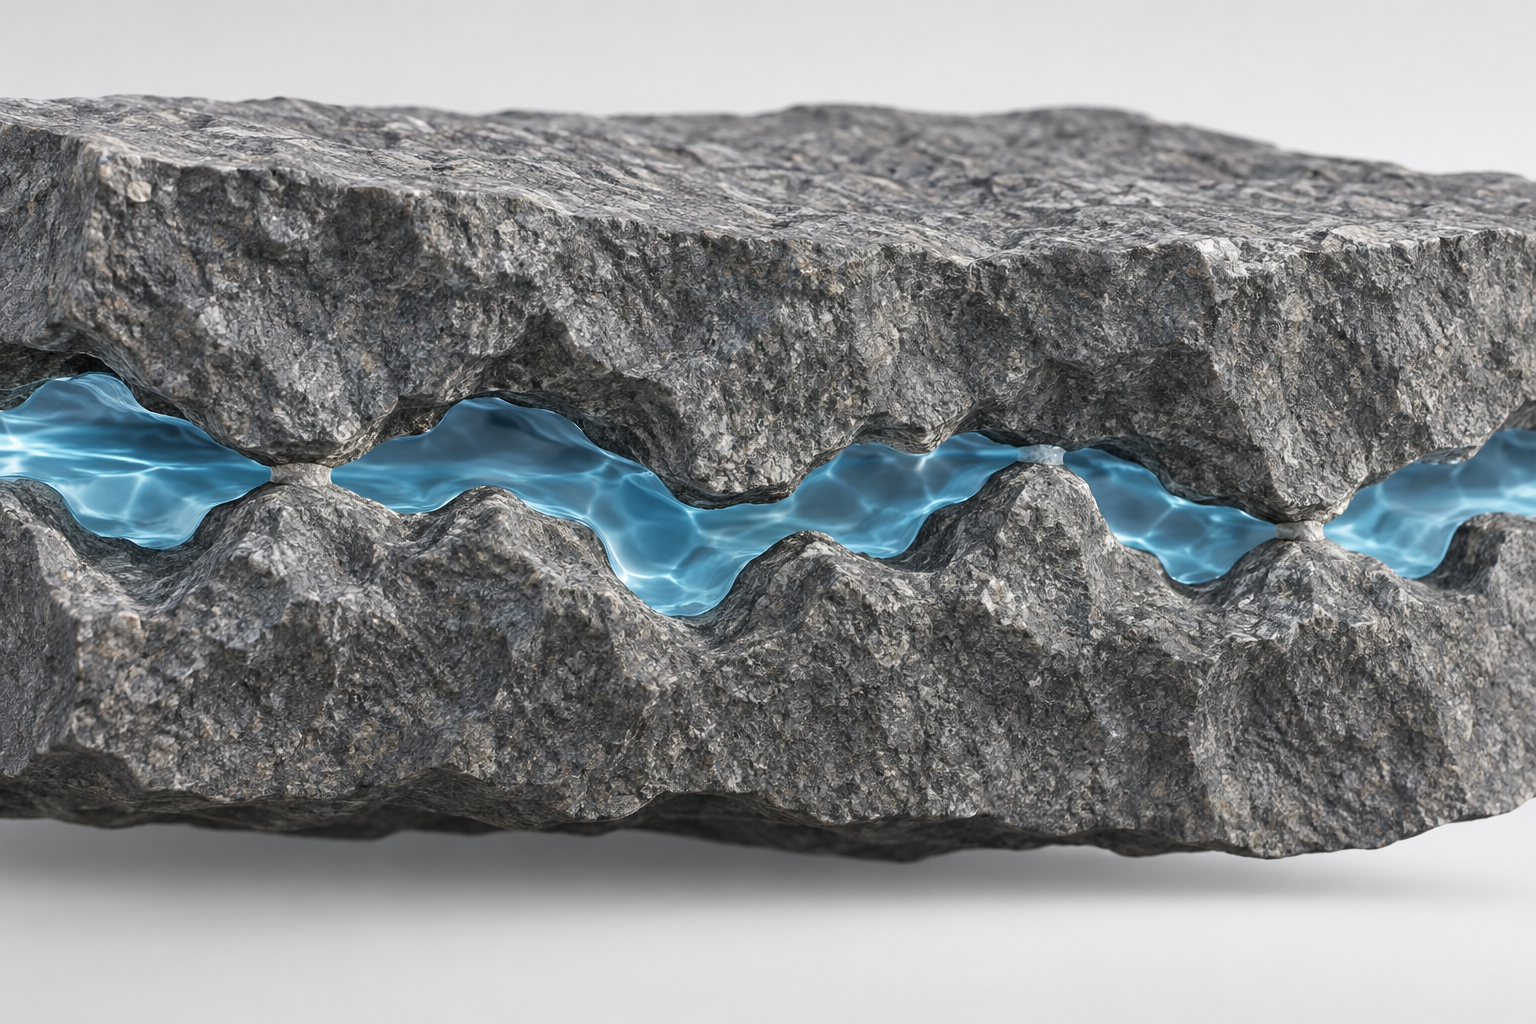
A rough fracture is a network of contacts and openings rather than a uniform water channel. This note explains how experiments on shaped Carrara marble surfaces were connected to a normal-contact calculation and a separate hydraulic model. The mechanical stage supplied the spatial aperture field needed to estimate flow. Surface matching and applied stress strongly affected the comparison with measured transmissivity, while shear experiments showed why sliding cannot automatically be assumed to improve transport. The article distinguishes the solver contribution from surface generation, hydraulic calculations and geological interpretation. It also explains the limits of transferring this laboratory workflow to other rocks or to full geothermal reservoirs.
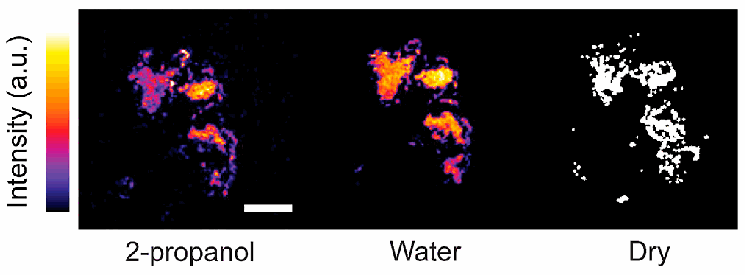
Lower friction can reflect a smaller contact area or an interface that is easier to shear. This note explains how a polypropylene–glass study separated those possibilities using fluorescence measurements and a dry TriboSolver contact calculation. The liquid-lubricated and dry contact areas differed only slightly, while the inferred mean shear stresses differed substantially. Separate vapor experiments then connected friction with molecular mobility and a thermally activated shear model. The article presents the reported mechanical comparison, distinguishes liquid controls from vapor measurements, and makes clear which molecular conclusions came from additional experiments rather than the solver. Supporting input parameters still require retrieval before an exact numerical reconstruction can be claimed.
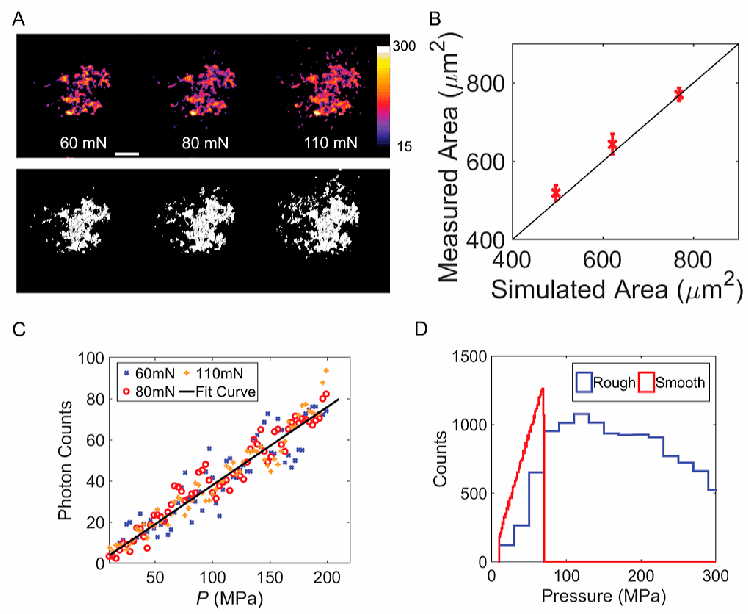
An optical contact image does not automatically reveal local pressure. This application note explains how a 2024 study combined a pressure-sensitive fluorescent probe with TriboSolver calculations for a rough polymer bead against glass. The authors compared contact areas and then separately calibrated fluorescence intensity against calculated pressure. The article explains that distinction, the role of measured surface topography and image alignment, and the reported contrast between rough and ideal smooth contacts. It also identifies the supporting-information inputs that still require verification before an exact reconstruction. The result is a guide to interpreting simulation-assisted contact measurements without treating a calibrated pressure map as an independent validation of the same mechanical calculation.
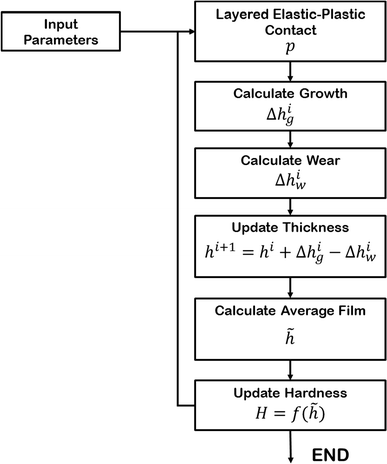
Protective tribofilms can grow and wear at the same time. This note explains a historical model that combined layered contact mechanics with stress-activated chemical growth and film removal. Comparisons covered an AFM-scale contact and rough steel contacts at several temperatures. The article identifies the inputs, explains why reduced contact pressure alone did not stop growth, and distinguishes removal of the film from loss of substrate material. It also presents the published substrate-wear comparison while making clear that its parameters were calibrated to experimental data. This is a research-history application note, not a current-software tutorial: the tribofilm-growth model described here is not presented as an available capability of the current TriboSolver release.
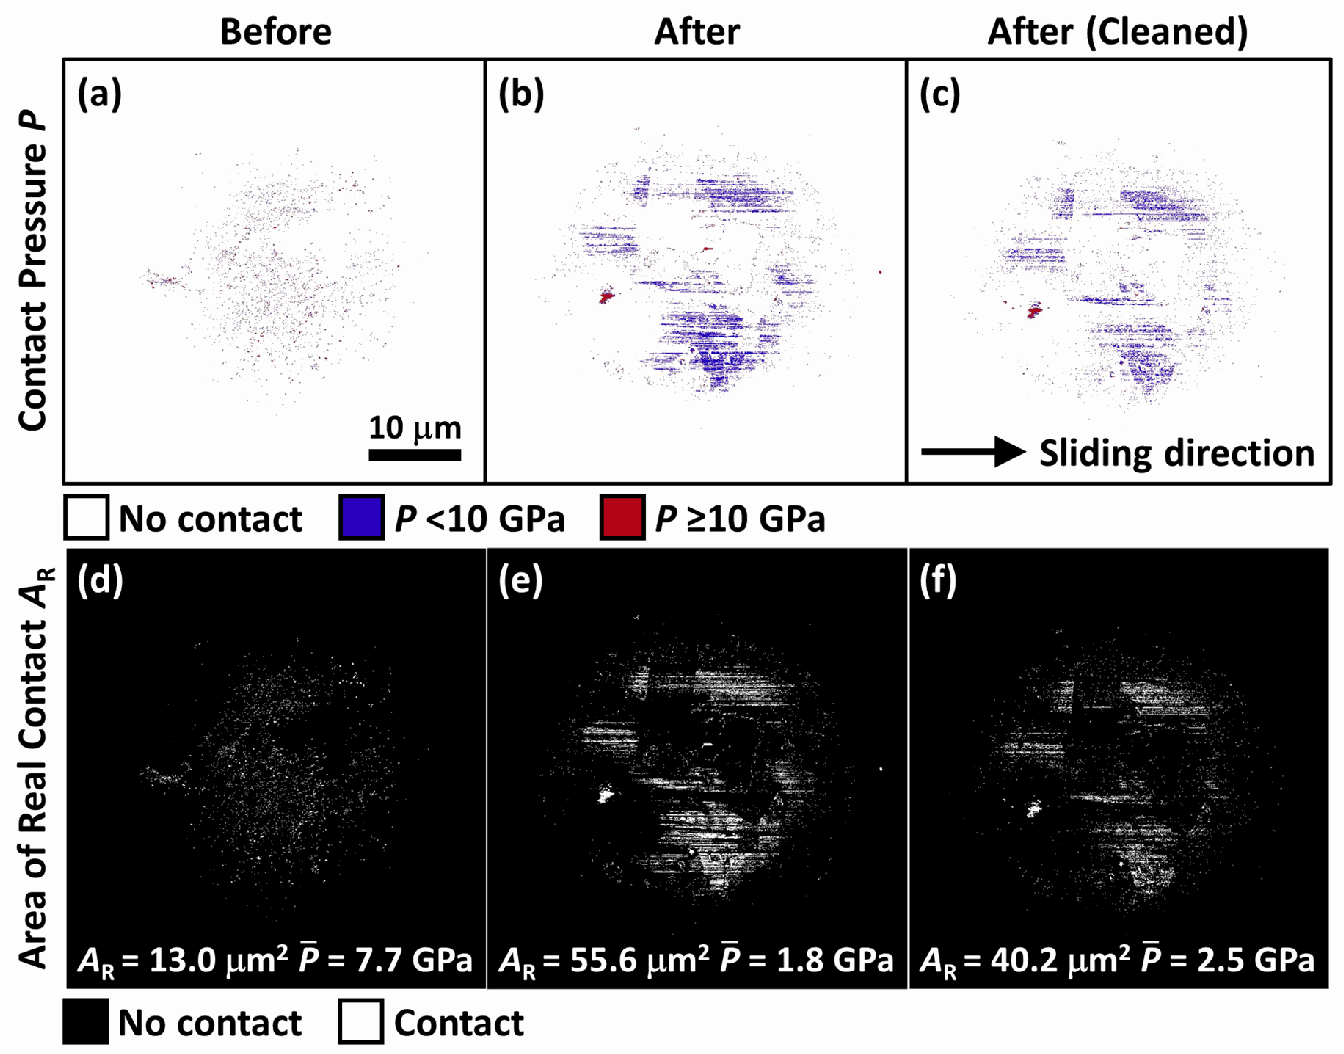
A new sliding contact changes as its highest asperities deform or wear away. This application note explains how a silicon carbide–silicon study connected measured surface changes with calculated pressure, real contact area and observed wear tracks. TriboSolver’s earlier generation supplied mechanical snapshots of the interface before and after sliding; it did not generate the complete wear trajectory. The article presents the reported material properties and calculation inputs, explains the reduction in mean pressure, and examines why simplified ploughing estimates underpredicted measured friction. The result is a practical example of using contact mechanics to interpret running-in while retaining the effects of debris, evolving counterface geometry and other processes outside the model.
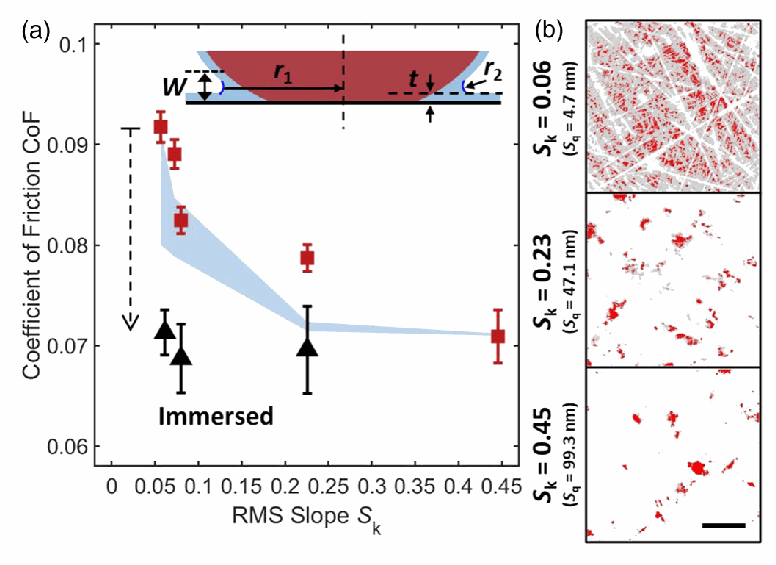
Polishing does not always reduce friction. In humid air, smoother surfaces can support larger regions of condensed water, creating an attractive force around the microscopic solid-contact spots. This application note explains a 2021 silicon nitride–sapphire study that combined measured topography, contact imaging, friction tests and numerical contact mechanics. TriboSolver’s earlier generation supplied real contact area and gap maps; the researchers then applied a separate capillary model. The article identifies the reported inputs, explains the distinction between solid-contact and wetted area, and shows why an approximately fourfold change in contact area produced a much smaller friction change. It also explains the assumptions and limits that matter when extending this workflow to another interface.
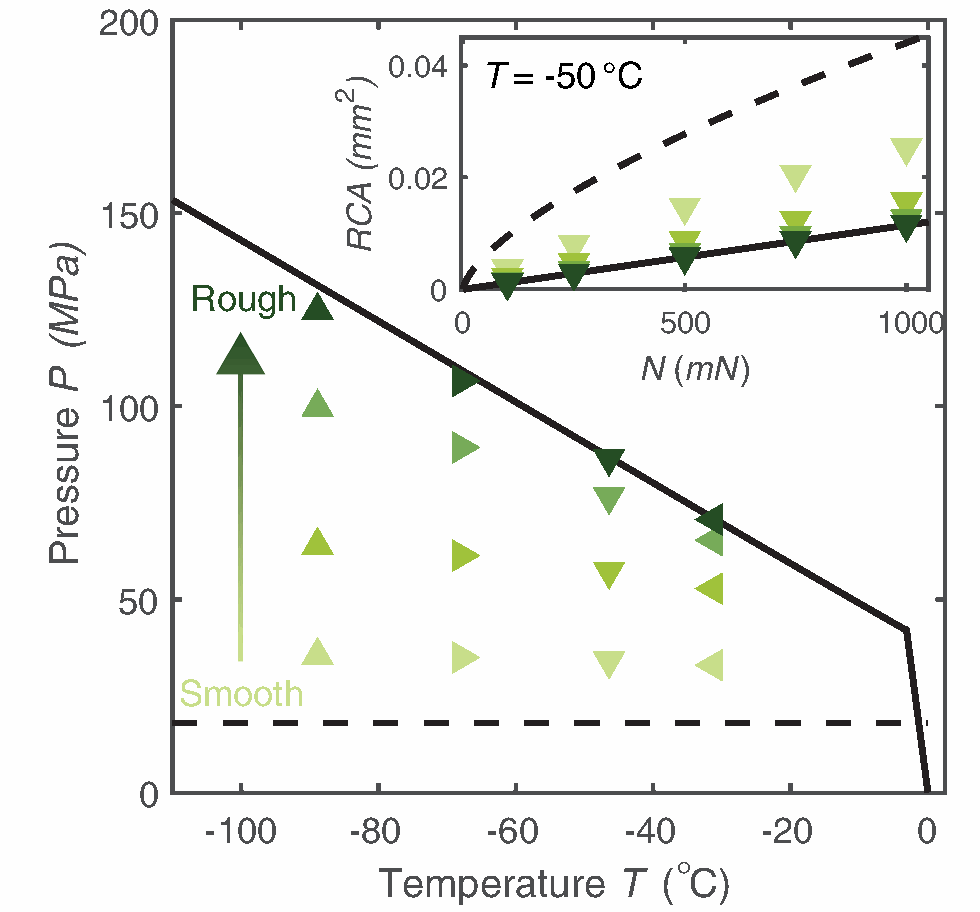
Why can one object slide easily on ice while another grips or scrapes? This application note examines a 2021 study that combined friction experiments with contact calculations to connect measured surface roughness to real contact area and pressure. It explains the glass-sphere test configuration, the inputs supplied to the earlier TriboSolver software, and the gap, area and pressure outputs used by the researchers. Reported pressure values are distinguished from measured friction and from the authors’ separate ploughing model. A source-linked input table and a published result figure make the reasoning traceable. The note also identifies missing numerical settings and explains why the research is not a universal ice-friction prediction or a verification of today’s release.
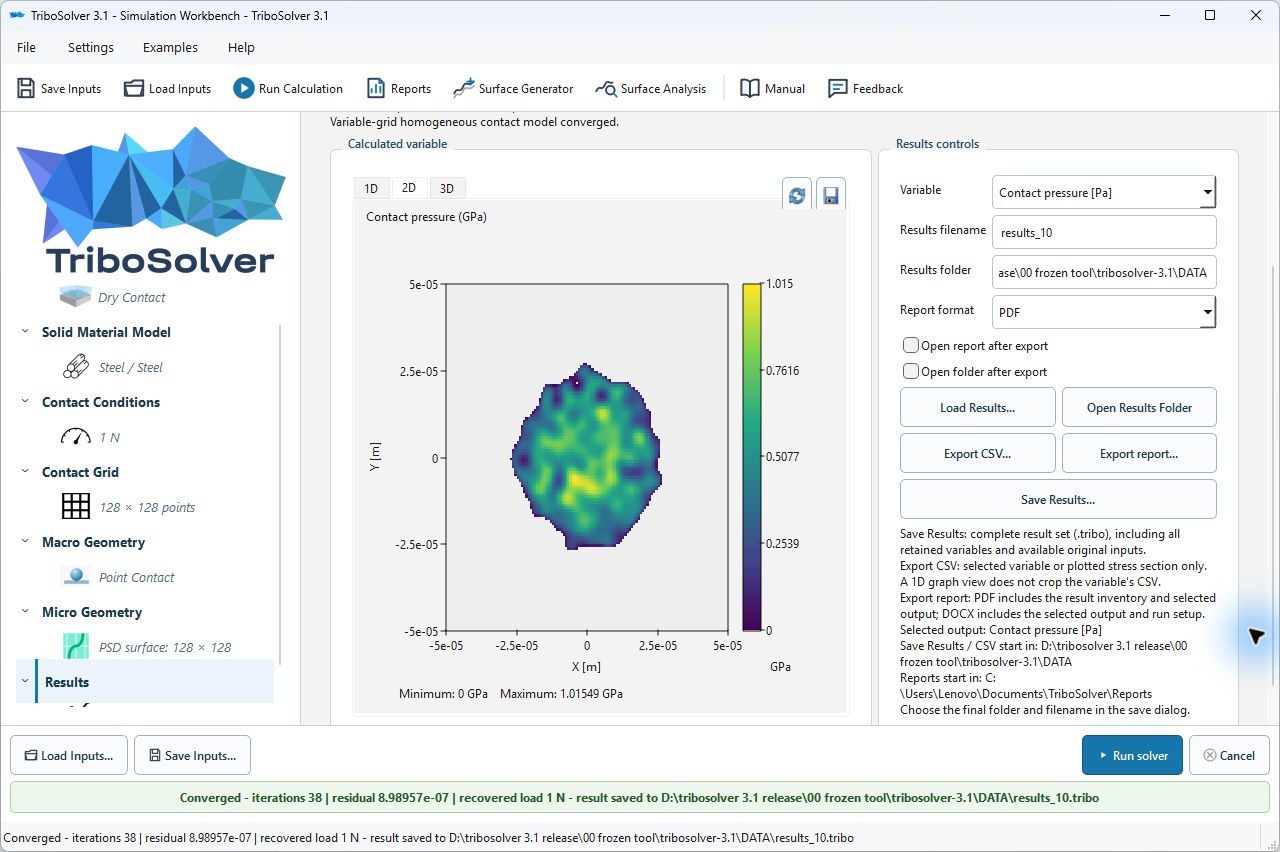
Set up rough contact manually in TriboSolver 3.1, generate a surface, interpret the results and export a report. Includes an English-narrated walkthrough.
- 1
- 2