

Rough Fracture Flow: How Contact Mechanics Supplies the Missing Aperture Map
Why a rough crack does not behave like an open pipe
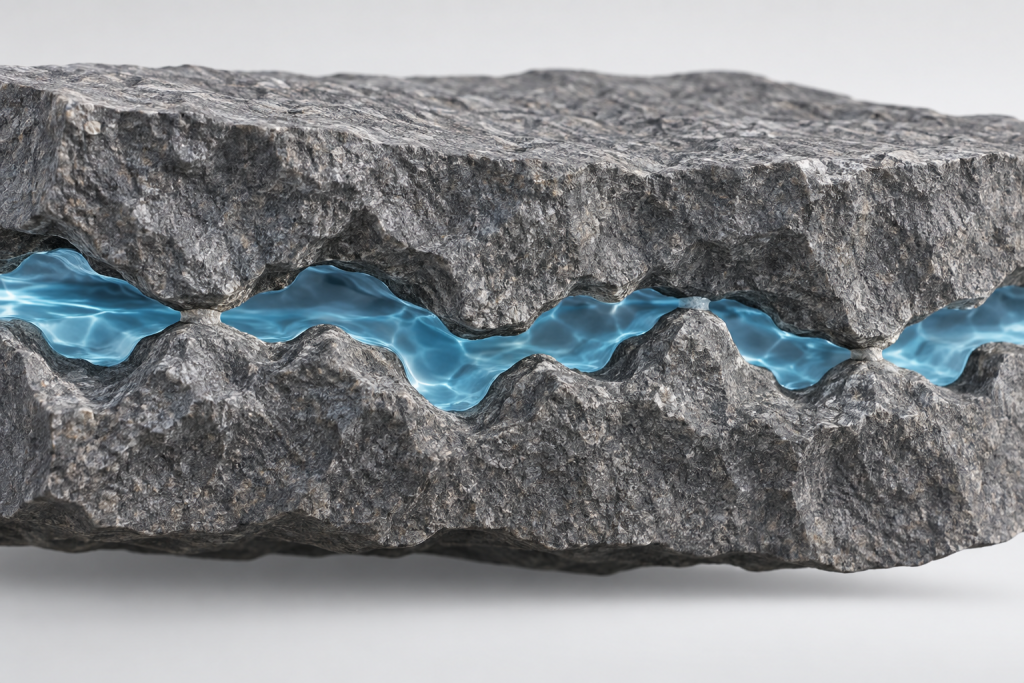
Water moving through rock often follows fractures rather than passing through the intact material. Yet a fracture is not an empty, uniform channel. Its two rough walls touch at scattered locations, leaving a connected network of narrow openings. Increasing the normal stress can enlarge those contacts and close the routes that previously carried most of the flow.
This makes average separation an incomplete description. Two fractures with similar average openings can have different hydraulic behaviour if one contains continuous channels and the other contains restrictive bottlenecks. The spatial arrangement of contacts and gaps matters, alongside the material response and the pressure driving the water.
Acosta, Maye and Violay investigated this relationship using deliberately shaped Carrara marble fractures. Their 2020 journal study combined laboratory measurements with a contact-mechanics calculation and a separate flow calculation. A 2022 geothermal-workshop paper presents the same research and additional discussion; it is not a second independent validation.
The investigated system
The experimental specimens were Carrara marble cylinders, 75 mm long and 36 mm in diameter. Fractures cut along the cylinder axis were used for normal-loading experiments. Separate specimens with a fracture inclined at 30 degrees were used to study shear loading and displacement.
Milling produced controlled grooves with different wavelengths and orientations relative to flow. The study included approximately 1.7 mm and 0.9 mm wavelengths, together with a ground comparison surface without an imposed macroscopic wavelength. Green-light interferometry characterized the surface heights. The authors used the power spectral density to describe how the height variations were distributed across spatial scales.
In the normal-loading tests, the confining pressure was 43 MPa. Adjusting the mean fluid pressure changed effective normal stress from 28 to 40 MPa. A 0.3 MPa pressure difference drove flow through the fracture. These are the conditions of that particular test sequence, not a replacement for the broader stress ranges describing all experiments in the publication.
Why contact mechanics was needed
A flow measurement gives an overall transport response. It does not reveal every microscopic opening inside an opaque loaded specimen. Conversely, measuring an unloaded surface does not tell us how that surface will deform when pressed against its opposing wall.
The mechanical calculation supplied the missing spatial link: which regions were touching and which remained open under a specified normal load. The open-region separation is called the geometrical aperture. It should not be confused with an equivalent hydraulic aperture inferred from a bulk flow measurement. One is a spatial field; the other summarizes transport under a particular model.
How the contact calculation was used
The source identifies the historical TriboNet dry-contact model and links to its Tribology Simulator download page. Here we describe that contribution within the TriboSolver application series, without implying that the current release performed the historical study.
The authors first generated artificial rough surfaces from the measured roughness statistics and added the macroscopic wavelength. These were statistically representative surfaces, not simply an untouched experimental height image imported into the solver. A half-space contact formulation then calculated deformation and contact between opposing surfaces using an elastic–perfectly-plastic response.
| Model element | Information used in the study |
|---|---|
| Contact bodies | Opposing calcite-bearing Carrara marble fracture surfaces. |
| Geometry | Rough fracture surfaces with controlled macroscopic waviness and different groove orientations. |
| Normal load | Normal-loading experimental comparison at effective stresses of 28–40 MPa; load follows stress and nominal area. |
| Surface input | Synthetic topographies based on measured height spectra, with an added macroscopic wavelength. |
| Material properties | Young’s modulus 30.2 GPa; Poisson ratio 0.3; stress-saturation threshold 0.2 GPa. |
| Contact model | Half-space dry contact with elastic–perfectly-plastic saturation. |
| Main mechanical outputs | Contact distribution and spatial geometrical-aperture field under normal loading. |
| Downstream calculation | Separate finite-volume Reynolds/local-cubic-law model for fluid flow and transmissivity. |
The complete numerical discretization is not specified in the accessible conference methods used for this expanded draft. The journal methods must remain the authority for reproducing the grid and boundary conditions; an illustrated zoom window is not a computational-domain specification.
From aperture maps to flow predictions
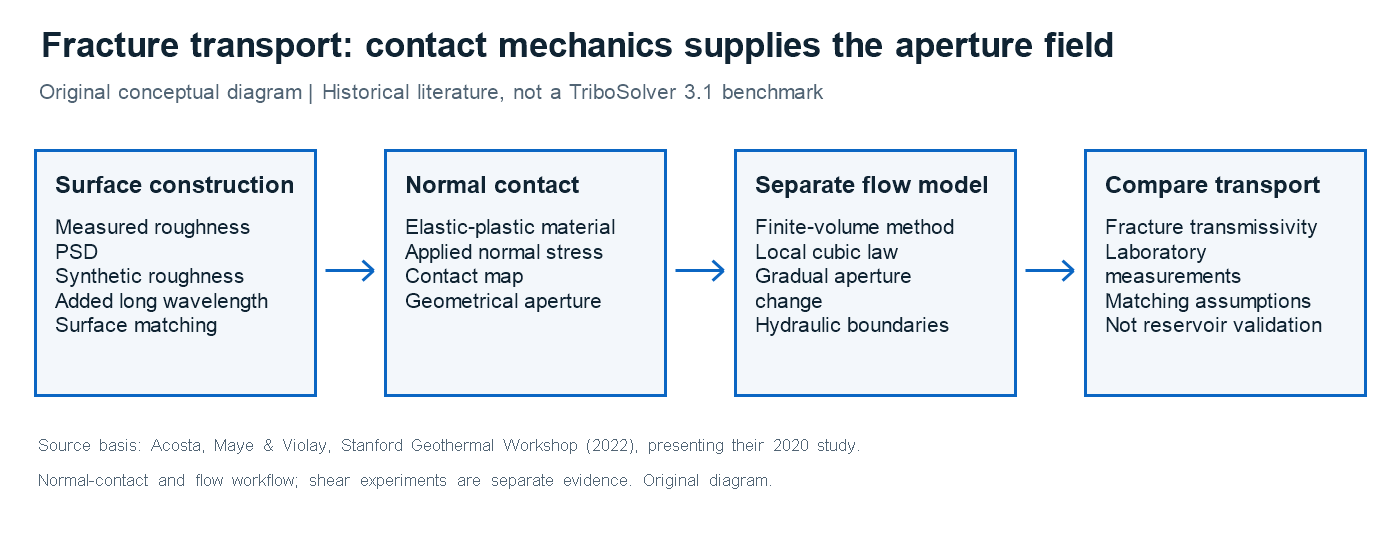
The reasoning chain was: measured roughness statistics → generated fracture surfaces → normal-contact and aperture maps → separate hydraulic calculation → comparison with measured transmissivity.
The flow stage used a finite-volume formulation of a Reynolds approximation, expressed through a local cubic law. In plain language, local flow capacity depends strongly on the opening between the walls. Narrowing a passage therefore matters much more than its small visual change might suggest. The approximation assumes sufficiently gradual aperture variations; it is not a general solution for every possible fracture geometry or flow regime.
Transmissivity describes the fracture’s ability to transmit fluid. In this paper it has units of cubic metres and is the product of permeability and an effective flowing thickness. It is neither a local gap height nor a volume flow rate. Keeping these quantities distinct is essential when comparing a mechanical map with the laboratory result.
Main findings: matching matters
The experimental results showed decreasing transmissivity with increasing effective normal stress, but the size of that decrease depended on surface geometry. For the large-wavelength transverse-groove specimen, the conference report gives approximately 3.05 × 10⁻¹⁸ m³ at 28 MPa and 0.76 × 10⁻¹⁸ m³ at 40 MPa.
The numerical comparison was particularly sensitive to whether the opposing surfaces were mated. For mated surfaces, more than 90% of calculated points fell within a factor of 2.5 of the measured values. Unmated configurations overpredicted transmissivity by roughly three orders of magnitude. The factor of 2.5 is a qualified description of this comparison, not a universal accuracy guarantee.
Parameter studies further showed that root-mean-square height and macroscopic wavelength could change transport strongly and non-monotonically. A single roughness number therefore cannot replace a description of how the two surfaces fit together. The mechanical geometry controls the hydraulic paths, not merely the total amount of empty space.
Shear experiments are a separate part of the evidence
The study also examined small irreversible shear displacements, up to about 1 mm. Those experiments did not support a general assumption that sliding must improve flow. Surface damage, debris and changing contact geometry could instead leave transmissivity unchanged or lower it.
These observations should not be described as a complete shear-wear simulation by the contact code. The authors explicitly identify coupled normal-and-shear evolution, plasticity and wear as areas requiring further modelling. Their discussion of geothermal stimulation is an interpretation of laboratory and numerical evidence, not an operational design prescription.
Practical meaning and conclusion
This workflow could be useful wherever contact geometry constrains a connected flow path. Its transferable lesson is methodological: first establish the loaded gap field, then apply an appropriate transport model and compare with measurements. Extending it to another material requires its own mechanical properties, roughness description and validation.
For these marble fractures, the combination of contact mechanics and a separate hydraulic model explained why stress and surface matching substantially changed transport. The value of the solver was to provide a mechanically grounded aperture field. The hydraulic result and its engineering interpretation came from the larger research workflow.
References and further exploration
Mateo Acosta, Robin Maye and Marie Violay. “Hydraulic Transport Through Calcite Bearing Faults With Customized Roughness: Effects of Normal and Shear Loading.” Journal of Geophysical Research: Solid Earth 125, e2020JB019767 (2020). Canonical journal publication.
The same authors’ 2022 Stanford Geothermal Workshop paper, “Hydraulic Transport Properties of Calcite Bearing Faults with Customized Roughness: Revisiting Hydro-Shear Stimulation Techniques,” provides the accessible methods and results discussed here. No protected journal figure is reproduced.
Explore TriboSolver for rough-contact analysis, or discuss your application through the website form. Hydraulic reservoir modelling is not claimed as an included product capability.