

How TriboSolver Helped Explain Roughness-Dependent Ice Friction
Why contact pressure matters when sliding on ice
Ice can offer very little resistance to sliding, yet the same surface can grip, scrape or resist motion when the shape of the contacting object changes. This matters in winter sports and in engineering contacts exposed to ice. A single friction coefficient cannot explain which response will occur: temperature, surface finish, load and speed all influence the interface.
The difficulty is that the load is carried by a small, hidden part of the apparent contact. Microscopic high points, called asperities, concentrate the force. The real contact area is the sum of the regions actually touching, rather than the outline of the whole object. Dividing the normal force by that area gives an average contact pressure, which can differ substantially from an estimate based on a smooth surface.
Liefferink and colleagues investigated this connection in a 2021 study. They combined sliding experiments, surface measurements, ice-hardness tests and numerical contact calculations. The useful lesson is that determining where the load is carried helps distinguish the mechanisms behind it. Read the original study.
The investigated system
The authors moved spherical sliders across smooth polycrystalline ice while measuring normal force and friction through a rheometer. Their wider experimental programme included silicon carbide, soda-lime glass and sapphire spheres, plus a short stainless-steel skate segment. This note focuses on the glass-sphere roughness comparison, where the connection between measured topography and calculated pressure is especially clear.
The glass spheres had a radius of 1.84 mm. Their root-mean-square height variation, Sq, was 98, 222, 575 or 3077 nm after removal of the spherical curvature for the roughness measurement. Different abrasive treatments produced the rougher finishes. Laser-scanning confocal microscopy measured patches of 208 × 208 µm, with 138 nm lateral sampling and 20 nm height resolution.
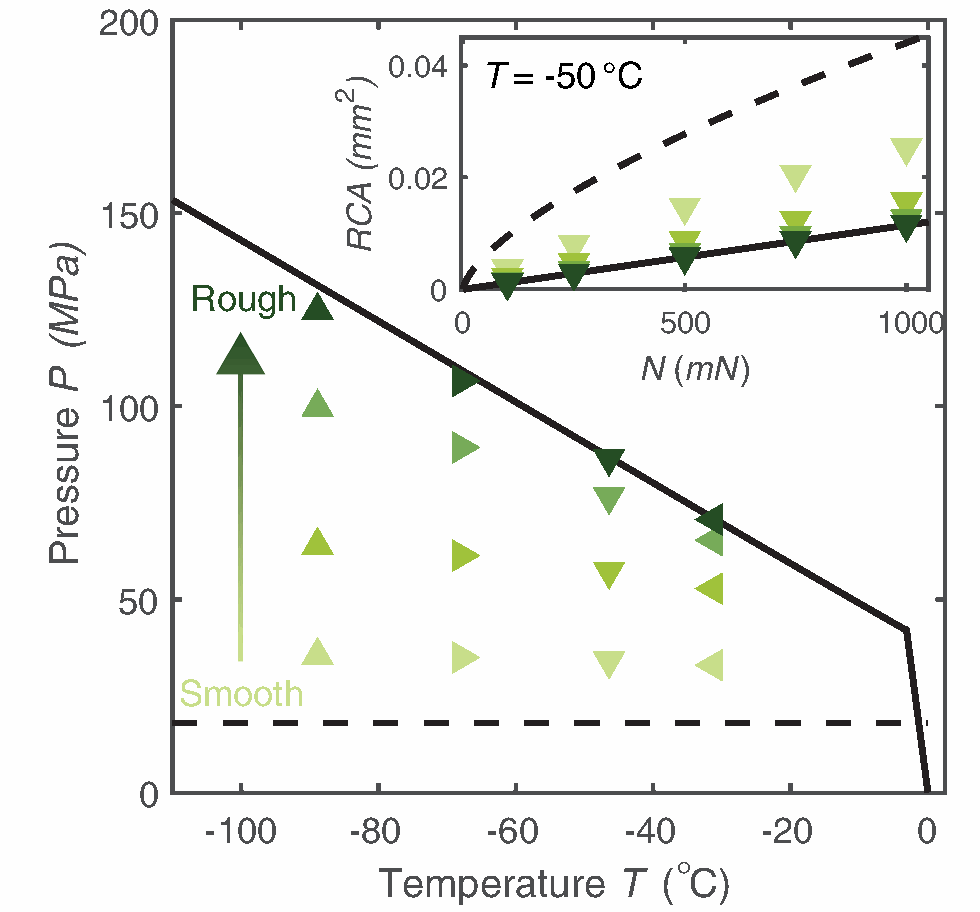
For the comparison in the paper’s Figure 3, sliding speed was 0.38 mm/s and temperature was −50 °C. The corresponding contact maps used a normal force of 0.5 N. Figure 8 extended the pressure comparison over temperature at the same 500 mN load. These conditions should not be mixed with the separate indentation tests or the study’s other sliding experiments.
Why a numerical contact model was needed
The instrument measured total forces, not the local pressure at each asperity. Surface images supplied geometry, but did not directly show the loaded interface. A model was therefore needed to connect the measured surface to the real contact area, gaps and pressure distribution.
An ideal smooth-sphere calculation offers a useful reference, but does not resolve the individual high points on a measured rough surface. Ice also deforms permanently when the loading reaches its penetration hardness. A purely elastic treatment cannot describe that limit. The calculation had to distinguish predominantly recoverable deformation from hardness-limited plastic contact.
How TriboSolver was used
The publication used TriboSolver’s elasto-plastic contact solver (previous version named Tribology Simulator) with the supplied measured slider topography, mechanical properties and normal loading to calculate contact conditions. They independently measured ice hardness as a function of temperature and indentation speed. That hardness set the plastic limit.
| Model element | Information used in the study |
|---|---|
| Contact bodies | Soda-lime glass sphere and polycrystalline ice. |
| Geometry | Sphere radius 1.84 mm; measured roughness superposed on the spherical surface. |
| Normal load | 500 mN for Figures 3(c) and 8; other force-dependent comparisons are reported separately. |
| Surface input | Measured 208 × 208 µm slider patches; Sq = 98, 222, 575 and 3077 nm. Instrument sampling: 138 nm/pixel laterally; height resolution: 20 nm. |
| Material properties | Glass: elastic modulus 65 GPa, Poisson ratio 0.22, hardness 5.7 GPa (Table I). Ice: elastic modulus 0.75 GPa, Poisson ratio 0.33; temperature- and speed-dependent measured hardness. |
| Contact model | Elastic–plastic, with the plastic limit set by ice penetration hardness. BEM/half-space formulation and an explicit “perfectly plastic” designation: not reported in the accessible source. |
| Numerical settings | Final solver grid, resampling, convergence tolerance and software version: not reported in the accessible source. Measurement sampling is not a verified solver-grid specification. |
| Main TriboSolver outputs | Interfacial gap at the topography coordinates; zero-gap contact regions; real contact area; local and average contact pressure. |
| Downstream calculation | Measured friction divided by calculated contact area to obtain mean shear stress; separate ploughing analysis and fitted temperature/pressure interpretation. |
The authors neglected ice topography in their main contact calculation. They reported that including it changed pressure by only 4% in their comparison; the measured ice roughness was 61 nm. That is a study-specific sensitivity check, not a general reason to ignore the roughness of the second body.
From simulation result to scientific conclusion
The reasoning starts with measured geometry and ends with a comparison to independently measured friction. Zero-gap regions define contact area. Normal force divided by that area gives average contact pressure; measured tangential force divided by the same area gives average interfacial shear stress. Neither ratio describes the stress at every individual point.
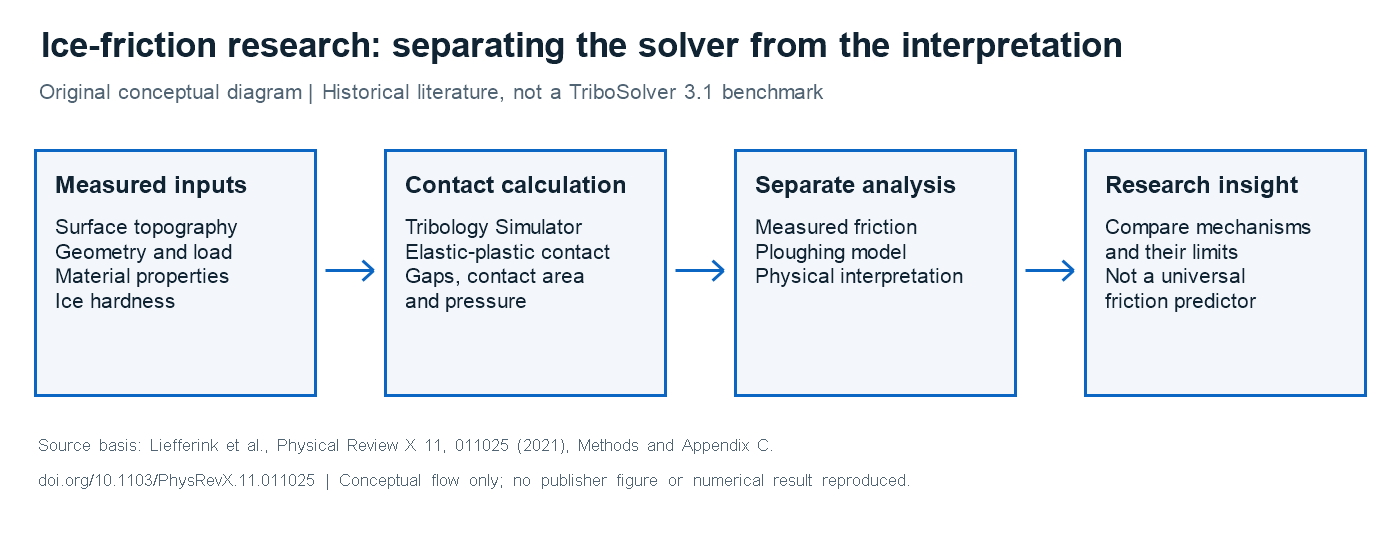
The authors then examined how shear stress varied with pressure and temperature. They separately estimated ploughing: resistance caused by pushing material aside as the slider moves. This separation matters because a pressure map alone does not determine how much friction comes from ploughing, molecular mobility or other processes.
Main findings
At −50 °C, the paper reports an average pressure of about 35 MPa for the smoothest glass sphere and about 85 MPa for the roughest case, where the pressure approached the ice hardness. Increasing roughness therefore changed more than a surface statistic: it changed the mechanical regime of the interface.
The friction increase was not explained by ploughing alone. Appendix D estimated that ploughing accounted for approximately 30% using the measured wear-track geometry, or up to 40% using a topography-based estimate. The remaining response supported the authors’ pressure-dependent interfacial-shear interpretation. Those estimates are model-assisted interpretations, not direct measurements of molecular motion.
What TriboSolver contributed
Reproduction would require the original height maps and the missing implementation settings. Finite scan size also matters: Appendix C limits the large silicon-carbide sphere calculation to 400 mN because its contact extends beyond the measured patch at higher loading. This example illustrates why a physically representative surface window must be checked, rather than chosen only for computational convenience.
Practical applications
The workflow could be useful when comparing slider finishes or studying why an ice-contact experiment changes after a surface treatment. It may also help organise investigations of ice-exposed components: measure the geometry, establish material response at the relevant temperature, calculate contact quantities, and compare them with force measurements.
These are possible extensions, not applications independently validated by this paper. Snow, debris-rich reciprocating contacts and hydrophobic surfaces introduce additional physics. The study itself highlights chemistry and debris as matters requiring care. Likewise, improving agreement with a fitted experiment is not the same as predicting a new operating condition without adjustment.
Conclusion
The study shows how surface measurements and contact calculations can explain why apparently similar ice contacts behave differently. TriboSolver supplied the mechanical quantities linking roughness to pressure; experiments and separate models supplied the friction interpretation. The transferable lesson is to keep those contributions visible and compare like-for-like conditions.
Reference and software links
Rinse W. Liefferink, Feng-Chun Hsia, Bart Weber and Daniel Bonn. “Friction on Ice: How Temperature, Pressure, and Speed Control the Slipperiness of Ice.” Physical Review X 11, 011025 (2021), published 8 February 2021. Canonical publication · Open-access published paper, including Appendices A–D.
Explore TriboSolver for rough-contact analysis, or discuss your application. This literature note documents a research workflow, not a current-release verification test or endorsement by the authors.