

Ceramic Roughness and Wear: What a Contact-Pressure Calculation Adds
Why a rougher ceramic can wear more without a large friction change
Friction and wear are related, but they are not interchangeable measures of contact performance. A small change in friction does not necessarily mean a small change in damage. Surface roughness can concentrate a normal load onto fewer asperities, changing local mechanical conditions even when the measured friction coefficient changes only modestly.
This distinction is important when comparing surface finishes or lubricant formulations. A friction measurement summarizes the tangential resistance of an entire interface. A wear measurement describes material damage after sliding. Contact mechanics supplies a third perspective: how the load is supported across the actual contacting regions.
Rodriguez-Rodriguez and colleagues investigated ceramic and glass contacts as part of a wider study of micro-fibrillated cellulose suspensions. Within that work, TriboSolver was used specifically to interpret a ceramic roughness comparison. The calculation should not be confused with simulation of cellulose fibres, liquid rheology or the entire experimental programme.
The investigated system
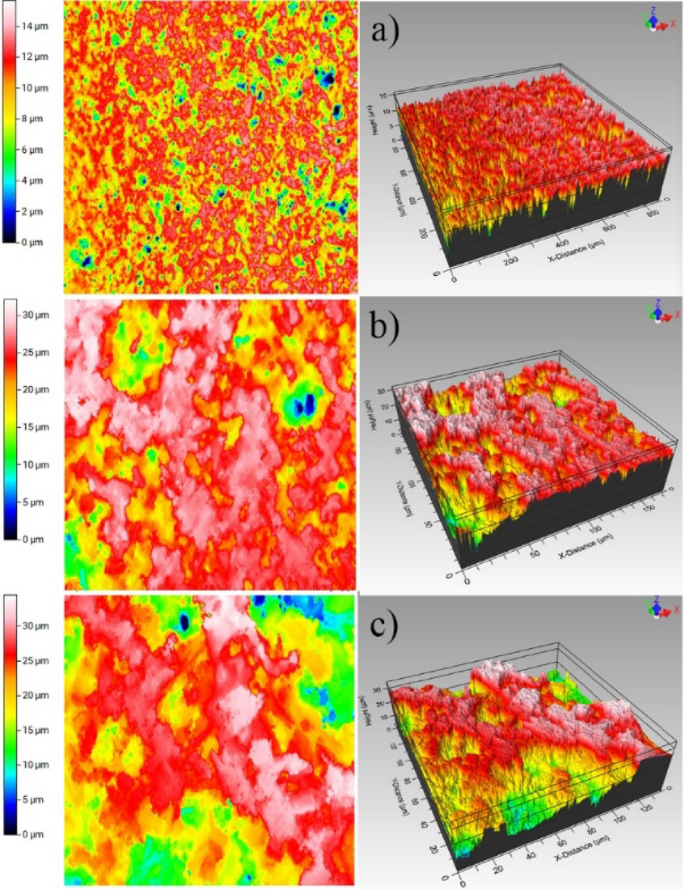
The roughness comparison used a ceramic bead sliding on three alumina substrates under ambient conditions, without cellulose or xanthan-gum solution. Their reported arithmetic mean roughness values, Ra, were 1.00, 2.20 and 3.00 µm. Glass beads were not tested in this particular part of the study.
The load was 5 N. The Figure 6 caption reports a sliding velocity of 2 mm/s, sliding distance of 200 mm and 30 loops. These conditions belong to the roughness comparison and should not be silently combined with the shorter-distance liquid experiments elsewhere in the paper.
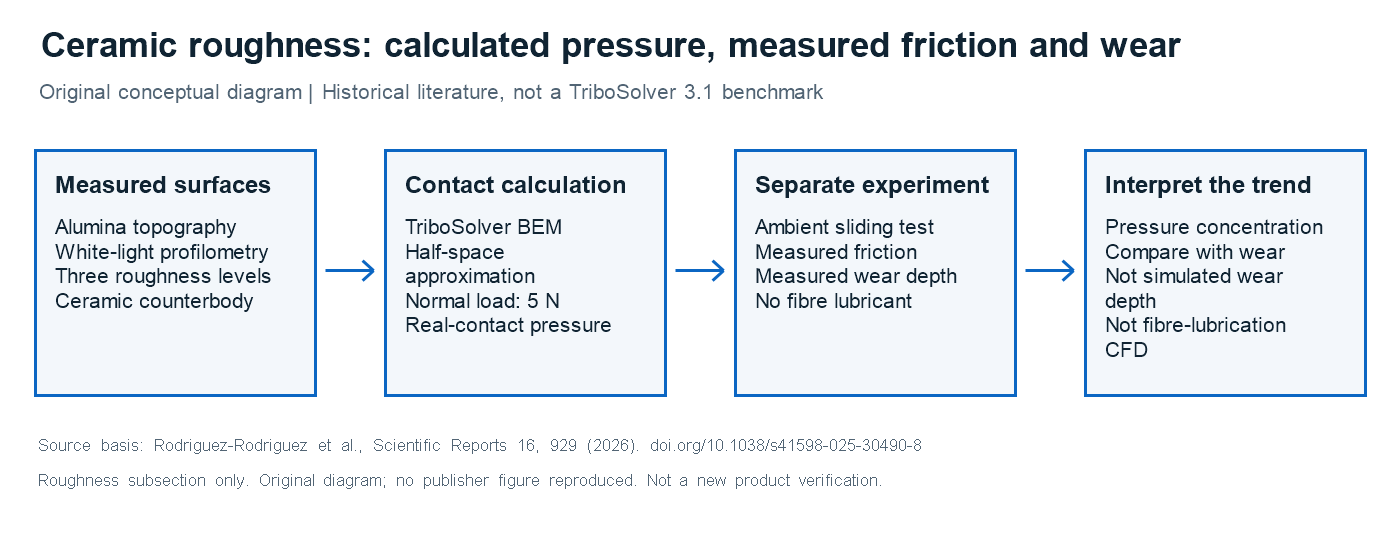
White-light interferometry characterized surface topography and wear tracks. The study reports measurements at three locations for surface characterization and repeated tests with fresh beads and substrates. Friction came from measured tangential and normal forces; wear depth came from post-test surface measurements. Neither quantity was simply read from a simulated pressure map.
Why a numerical contact model was needed
A smooth-body Hertz calculation provides a useful description of apparent contact geometry. It does not resolve how a measured rough surface divides that apparent footprint into individual load-bearing patches. The same nominal load can therefore produce different real contact areas and pressure levels on different surface finishes.
For the roughness analysis, the authors explicitly used TriboSolver to calculate contact pressure with the real contact area. Their method is described as a boundary-element calculation using a half-space approximation. The mechanical unknowns include pressure, elastic deflection, contact area and rigid-body approach, constrained by the applied normal load.
The published description is sufficient to establish the role of the calculation, but not a complete reproducible input deck. The exact height-array processing, numerical grid, all material constants and any pressure-saturation settings are not fully documented in the accessible methods. They should not be reconstructed by guessing from a plotted surface image.
How TriboSolver contributed
| Model element | Information used in the study |
|---|---|
| Contact bodies | Ceramic bead against alumina substrates A, B and C; not the glass-bead branch of the wider study. |
| Geometry | Bead–flat rough contact. The exact numerical geometry settings are not fully specified in the accessible contact-method description. |
| Normal load | 5 N for the three-surface roughness comparison. |
| Surface input | WLI-characterized alumina surfaces: Ra 1.00, 2.20 and 3.00 µm; corresponding Rq 1.31, 2.56 and 3.51 µm. |
| Material properties | A complete pair of elastic input sets and any hardness settings are not provided in the accessible model description. |
| Contact model | Boundary-element half-space approximation with elastic deflection and normal-load equilibrium. |
| Main outputs used | Real-area-based contact pressure for the roughness comparison. |
| Experimental comparison | Measured friction coefficients and measured mean wear-track depths. |
The two roughness measures describe different averages of surface height. Ra is the arithmetic mean absolute deviation, while Rq is the root-mean-square deviation. Neither scalar specifies the complete arrangement of peaks and valleys. The spatial topography remains important to a contact calculation even when a table lists only summary roughness values.
The principal numerical comparison
The paper reports the following pressure values for the 5 N roughness comparison. These are reproduced as reported, without relabelling them as maximum asperity pressures or inventing unreported contact-area values.
| Alumina finish | Ra | Reported contact pressure |
|---|---|---|
| A | 1.00 µm | 594 MPa |
| B | 2.20 µm | 767 MPa |
| C | 3.00 µm | 829 MPa |
Across the endpoint finishes, the measured friction coefficient increased from 0.36 to 0.46. The Results section gives a mean wear-track depth increase from 0.27 to 1.31 µm. Thus the change in wear was much more pronounced than the change in friction, while the mechanical calculation indicated increasing pressure associated with roughness.
There is a reporting inconsistency worth retaining rather than hiding: the paper’s conclusion gives a different wear-depth range from its roughness Results paragraph. This note uses the explicitly identified roughness Results values. Exact reuse of the dataset for numerical reproduction would require clarification of that discrepancy and access to the underlying measurements.
From pressure to a scientific interpretation
The reasoning chain was: measured surface topography → rough-contact pressure calculation → comparison across finishes → interpretation alongside friction and wear measurements.
The authors interpret rougher surfaces as supporting load over smaller contacting regions, increasing localized pressure and deformation during sliding. This offers a mechanical explanation consistent with the observed wear trend. It does not mean that pressure alone uniquely determines wear, or that the three pressure values constitute a calibrated wear law.
The distinction is especially important for ceramics, where local damage, debris and evolving surface geometry may influence the sliding response. A static contact analysis can reveal a pressure-related mechanism without calculating every stage of material removal. The experimental wear measurements remain essential evidence.
How this relates to the cellulose experiments
The wider paper compares micro-fibrillated cellulose suspensions with xanthan-gum solutions chosen to provide similar rheological behaviour. Those experiments explore whether the physical presence of fibres changes friction and wear beyond the effect of liquid viscosity alone.
That is a separate experimental comparison. The roughness calculations do not demonstrate that TriboSolver tracked individual fibres, predicted suspension structure or calculated the reported lubricant performance. Combining the two parts into one claimed simulation would overstate the software’s role and obscure what the researchers actually measured.
Practical meaning and conclusion
This approach could help engineers compare surface finishes when friction alone gives an incomplete picture. A useful assessment combines measured topography, a clearly defined pressure calculation and a separate damage measurement. Repeating the workflow for another material requires its own properties, surface data and test conditions.
The study illustrates a focused use of contact modelling within a broader tribology investigation. TriboSolver supplied mechanical context for the roughness comparison; laboratory observations established the friction, wear and lubricant behaviour. Keeping those roles separate makes the research more informative and its limitations easier to understand.
Reference and further exploration
Javier Rodriguez-Rodriguez, Richard Greenwood, Lewis Taylor, Jonathan Phipps, David Skuse and Zhenyu Zhang. “Effect of cellulosic fibres on the interfacial friction between ceramic and glass.” Scientific Reports 16, 929 (2026). DOI and open-access publication. Published online in December 2025; version of record dated January 2026. These are versions of one paper, not separate applications.
Explore TriboSolver for rough-contact analysis, or discuss your surface-finish application through the website form.