

Running-In Wear: How TriboSolver Helped Interpret Changing Asperities
Why a new sliding contact changes during its first strokes
A newly assembled contact rarely begins in its final operating condition. Its highest surface features carry a disproportionate share of the load. Some deform, some wear away and others begin touching as the geometry changes. Friction can fall quickly, fluctuate or later rise again. This early evolution is called running-in, and it can determine whether a component settles into stable operation.
The apparent contact shape alone does not explain the process. A smooth-sphere estimate spreads the load over a comparatively broad region, while microscopic asperities can experience much higher pressures. Understanding running-in therefore requires a connection between individual surface features, the tracks they leave and the total friction force measured by the instrument.
Hsia and colleagues investigated that connection in a 2021 silicon carbide–silicon study. They measured the same sphere before and after sliding, calculated contact conditions and compared them with wear tracks and friction. Importantly, the paper reported where calculation and experiment disagreed as well as where they matched. Read the original study.
The investigated system
A 3 mm diameter silicon carbide sphere slid against a polished, single-crystal silicon flat with a native oxide layer. Initial root-mean-square roughness measured over 5 × 5 µm patches was 48.7 nm for the sphere and 0.9 nm for the flat. The harder sphere was therefore also the rougher surface.
The main experiments used a 100 mN normal force and 0.5 mm/s sliding speed. Each stroke covered 20 mm, and the sphere encountered fresh silicon rather than repeatedly traversing the same track. Short experiments covered 40 mm in total; longer experiments covered 6 m. Temperature was 20–22 °C and relative humidity 40–60%, without active environmental regulation.
The authors measured topography using atomic force microscopy (AFM) and optical profilometry. Electron microscopy and elemental analysis helped inspect tracks and debris. Comparing surfaces before and after sliding established where material had disappeared; contact calculations did not substitute for those wear measurements.
Why a contact model was needed
A smooth Hertzian estimate gave a contact pressure of approximately 0.46 GPa, far below the silicon hardness of 10 GPa. Yet the experiment showed ploughing tracks: grooves associated with asperities pushing through the softer material. Resolving the measured roughness was necessary to understand how the local pressure could reach the plastic limit even when the smooth-contact estimate remained low.
The calculation also allowed a spatial comparison. Instead of treating wear as one average volume, the researchers could ask whether a particular high-pressure asperity was located where a persistent track suggested it should be. Such agreement helps interpret a mechanism, although it does not prove every detail of the material-removal process.
How TriboSolver was used
The Methods identify the software as Tribology Simulator, the historical name in the TriboSolver lineage, and give www.tribology.org as its address. They describe half-space boundary element method (BEM) calculations of elastic–plastic asperity deformation. Strain hardening was neglected and contact pressure was limited by the hardness of the softer body, silicon.
| Model element | Information used in the study |
|---|---|
| Contact bodies | Direct-sintered silicon carbide sphere and polished silicon (100) flat with native oxide. |
| Geometry | 3 mm diameter sphere; measured roughness on the spherical surface. |
| Normal load | 100 mN for the Figure 3 contact calculations. |
| Surface input | 85 × 85 µm AFM sphere topography, 4096 × 4096 measurement pixels, before sliding, after 40 mm and after ultrasonic cleaning. |
| Material properties | SiC: E = 460 GPa, ν = 0.21, hardness 25 GPa. Silicon: E = 130 GPa, ν = 0.20, hardness 10 GPa. |
| Contact model | Elastic–fully-plastic BEM half-space approximation; no strain hardening; 10 GPa softer-body pressure cap. |
| Numerical settings | Measurement dimensions are reported; final resampling, convergence tolerances and software build are not reported in the accessible source. |
| Main TriboSolver outputs | Contact-pressure maps, real contact area, average pressure and calculated plastic indentation depth. |
| Downstream calculation | Projected ploughing area times substrate hardness for an estimated friction contribution; separate measured wear-volume and atomic-scale rate estimates. |
The scan was deliberately larger than the estimated 20 µm Hertzian contact diameter. That helps avoid losing part of the loaded region at the image boundary. It does not establish that every relevant roughness scale was resolved or that measurement pixels equal the final numerical grid.
From measured topography to a running-in interpretation
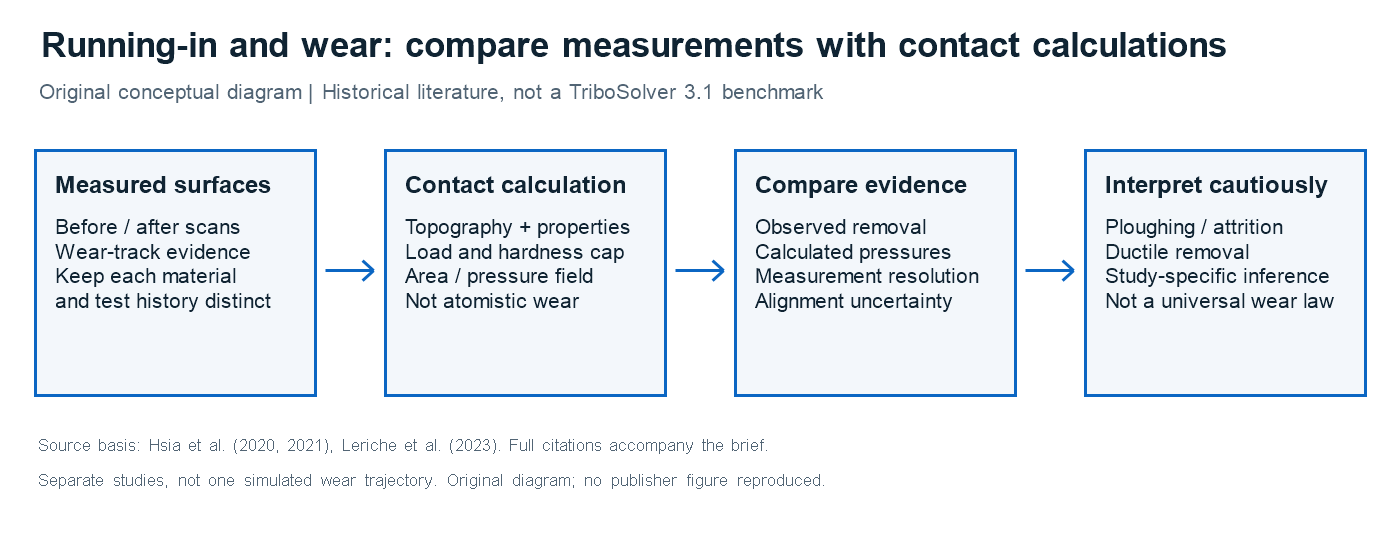
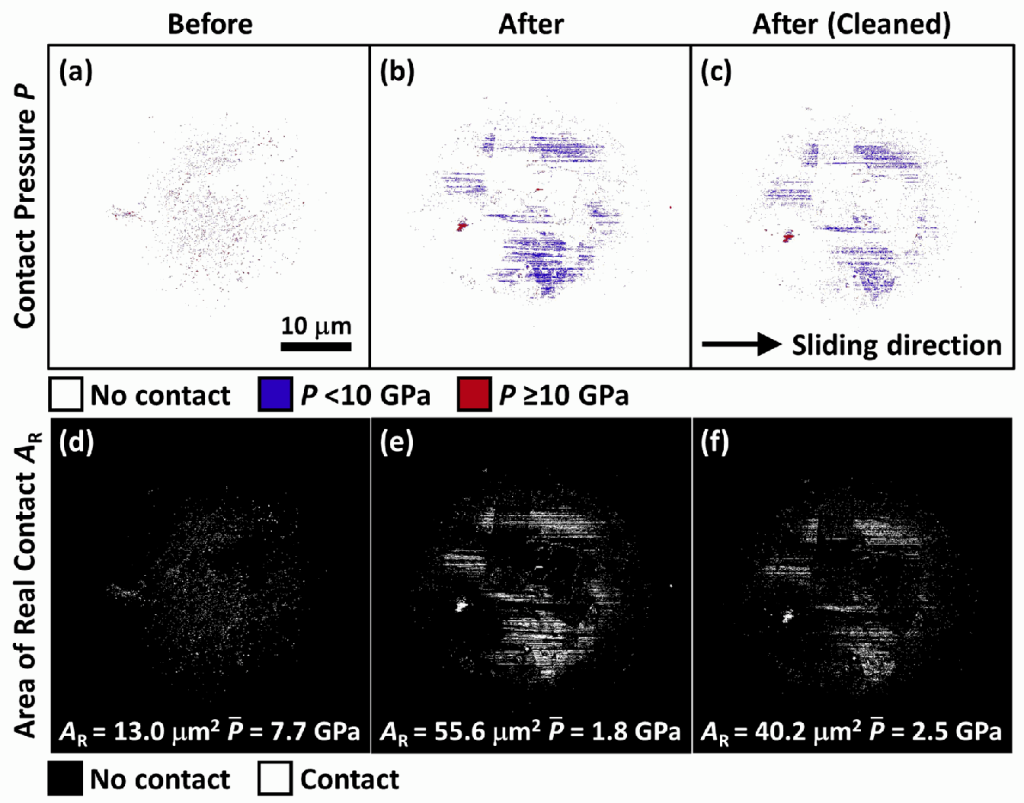
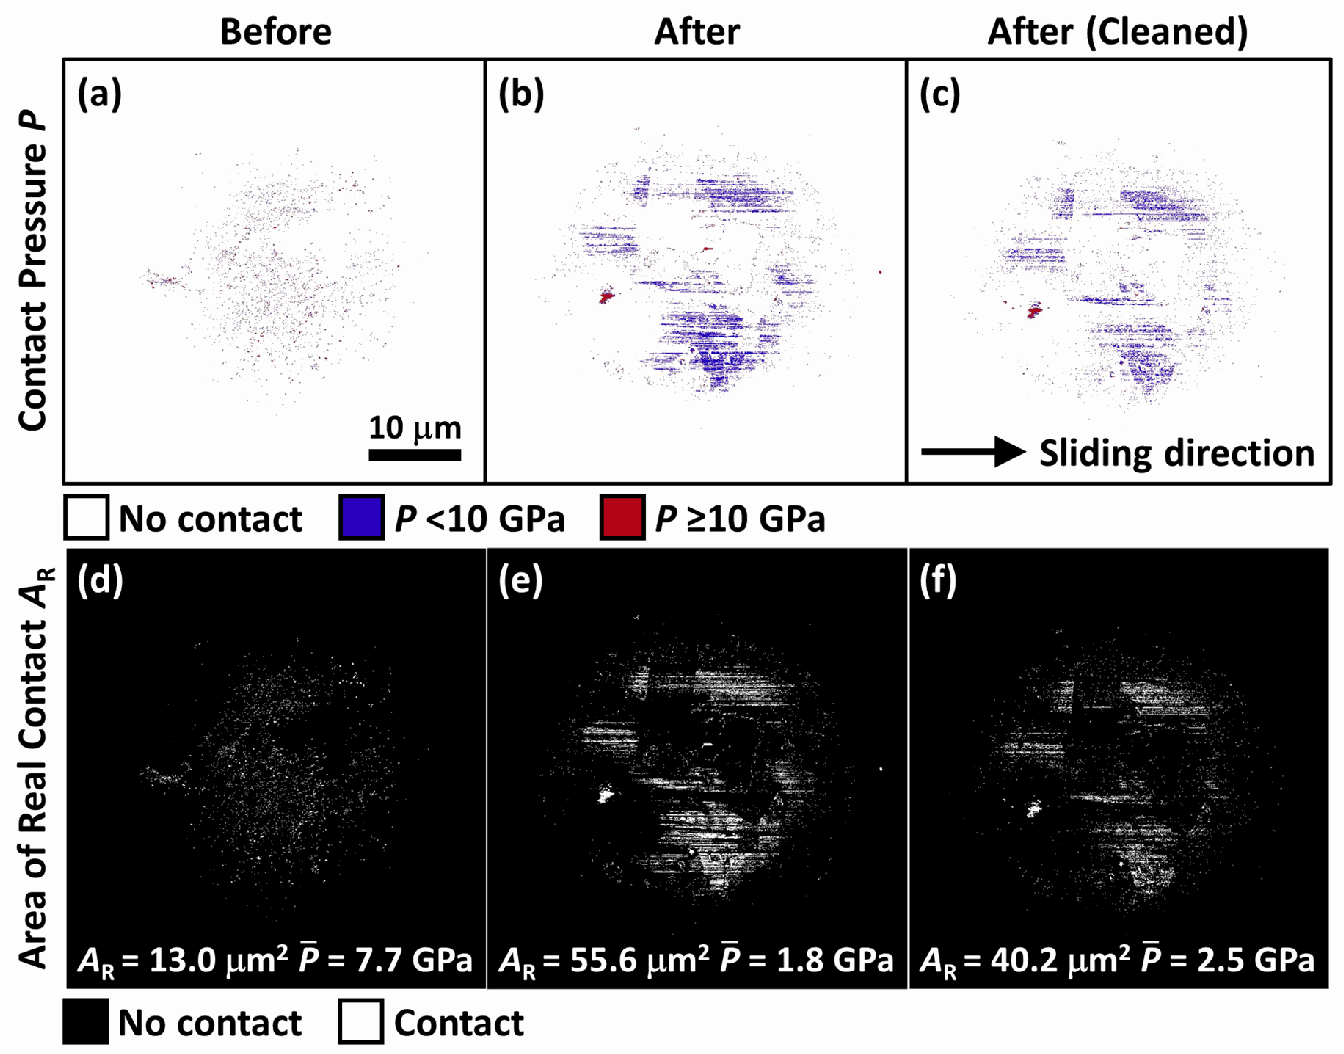
The researchers first calculated contact using the unworn sphere. They then repeated the calculation with measured post-sliding geometry and with the cleaned surface. These were separate snapshots of a changing interface, not a time-dependent prediction that generated the worn topography from the original surface.
Dividing 100 mN by the calculated real contact area gave average pressure. Local maps showed which asperities reached the silicon hardness. The researchers compared these locations with microscopy of the flat, then estimated a ploughing-force contribution from the area projected in the sliding direction and the silicon hardness.
Main findings: a larger contact carries lower mean pressure
Figure 3 reports an initial real contact area of 13 µm² and average pressure of 7.7 GPa. After 40 mm sliding, the calculated area increased to 55.6 µm² and average pressure fell to 1.8 GPa. After ultrasonic cleaning, the corresponding values were 40.2 µm² and 2.5 GPa. The distinction between uncleaned and cleaned surfaces matters because loose material changes the measured geometry.
The measured friction coefficient peaked near 0.63 at the onset and dropped toward 0.31 after approximately 15 mm. Many ploughing tracks disappeared as sphere asperities were removed. A persistent trailing-edge asperity remained a plausible source of a surviving track. These observations supported a transition away from strong early ploughing toward milder wear.
The discrepancies are part of the result
The simplified ploughing calculation estimated friction coefficients of 0.12 initially and 0.21 after 40 mm, below the measured 0.63 and 0.31. Predicted initial indentation depths of about 20 nm also did not match the observed track geometry quantitatively. The paper therefore does not demonstrate accurate prediction of total friction or worn-surface shape from the contact map alone.
Debris, compressed or elevated track material, oxidation-related volume changes and adhesion can all matter. Later asperities encounter material already disturbed by earlier ones. Treating a multi-asperity interface as independent single-asperity events misses these interactions. The longer experiment also showed friction increasing again over 6 m, so the early decrease was not a permanent universal trend.
What TriboSolver contributed—and what it did not
TriboSolver contributed: pressure, contact-area and deformation estimates for measured surface states.
Additional author analysis: microscopy, wear-volume differences, projected-area ploughing estimates and an atomic-attrition-like interpretation.
Not demonstrated: an atomistic simulation, autonomous prediction of the complete running-in trajectory, accurate total friction from isolated asperities or reproduction by the current software release.
Practical applications and conclusion
This approach could help investigate a new surface finish or a contact whose friction changes during commissioning. Measure the evolving geometry, calculate comparable contact snapshots and compare them with tracks and forces. A constant wear-rate assumption should be questioned when area, pressure and debris conditions are changing substantially.
The study shows both the usefulness and the limits of rough-contact analysis. Calculated pressure explains why an apparently lightly loaded contact can plough locally. It does not by itself describe every process that creates friction and wear. Keeping the measured evolution separate from the mechanical calculation makes the engineering interpretation more informative.
Reference and software links
Feng-Chun Hsia, Fiona M. Elam, Daniel Bonn, Bart Weber and Steve E. Franklin. “Tracing single asperity wear in relation to macroscale friction during running-in.” Tribology International 162, 107108 (2021). Canonical publication · Open-access published paper.
Explore TriboSolver for rough-contact analysis or discuss your application. For another example of separating contact mechanics from friction interpretation, see the capillary-adhesion note.