

How TriboSolver Helped Explain Capillary Adhesion and Friction
Why smoother surfaces do not always slide more easily
Polishing a surface removes high points, but it does not guarantee lower friction. In humid air, smooth surfaces can approach one another closely over a larger area. Water condensed into the remaining gaps can pull them together, increasing the load carried by the microscopic contact spots. This can matter in precision positioning, where a small change in resistance affects repeatability.
The difficulty is separating geometry from chemistry. A rough interface contains regions in solid contact, regions separated by a very small gap and more widely separated regions. These are not mechanically equivalent. The real contact area carries the repulsive load; nearby water bridges can exert an attractive force without belonging to that solid-contact area.
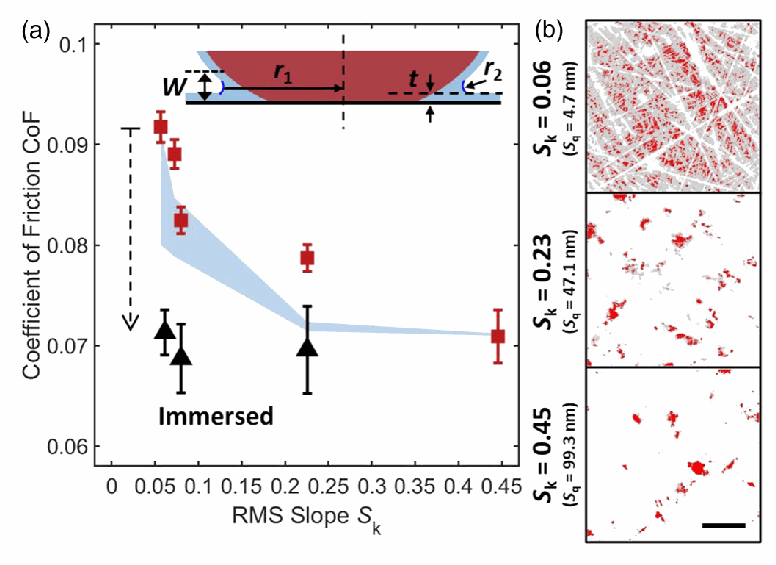
A 2021 study by Hsia and colleagues investigated this distinction using silicon nitride spheres and sapphire. It combined surface measurements, optical contact imaging, friction experiments and numerical calculations. Its central finding was counterintuitive: changing roughness altered real contact area strongly, but friction much less. A separate capillary-adhesion model explained the remaining systematic trend. Read the original paper.
The investigated system
The contact consisted of a silicon nitride sphere, 3.18 mm in diameter, pressed against a sapphire flat. Abrasion and polishing produced sphere surfaces with root-mean-square height variation, Sq, from 4.7 to 99.3 nm. Root-mean-square slope ranged from 0.06 to 0.45. Height variation describes the amplitude of the roughness; slope also describes how steep its features are.
Atomic force microscopy measured the topography. For the roughness comparisons, the authors used 10 × 10 µm images with 95.4 nm² per pixel. A separate contact-imaging comparison used a 60 × 60 µm scan with about 2000 nm² per pixel. These are pixel areas, not lateral pixel spacings. Sapphire was much smoother, with Sq of 0.14 nm over the reported scan.
Dry sliding experiments took place in ambient air at approximately 40% relative humidity and 1 µm/s. Here “dry” means that no bulk lubricant was introduced, not that the surface was free of adsorbed water. Applied forces reached 160 mN. The Figure 3 roughness calculations used forces up to 45 mN to retain comparable nominal pressure in the smaller simulated region.
Why a numerical contact model was needed
The experiment measured total normal force and friction, but those signals cannot identify every load-bearing asperity. Fluorescence microscopy supplied an independent view of the interface: a fluorescent liquid occupied accessible gaps, while contact regions appeared relatively dark. A numerical calculation was needed to connect the measured topography to this observed contact pattern and to the unresolved gaps around it.
Comparison required attention to resolution. The calculated image was convolved with a Gaussian microscope response with 600 nm full width at half maximum. Experimental and calculated images used different finite-gap thresholds, 6 and 9 nm respectively. Those imaging thresholds must not be confused with either ideal zero-gap mechanical contact or the smaller capillary-condensation range.
How TriboSolver was used
The source calls the software Tribology Simulator, an earlier name in the TriboSolver lineage; reference 46 lists www.tribology.org. Appendix B explicitly describes a boundary element method (BEM) half-space calculation with elastic–plastic deformation and no strain hardening. The material hardness limits the local pressure through idealized plastic flow. This is a historical research application, not a verification of the current release.
| Model element | Information used in the study |
|---|---|
| Contact bodies | Silicon nitride sphere and sapphire flat. |
| Geometry | Sphere diameter 3.18 mm; measured sphere topography; much smoother sapphire counterface. |
| Normal load | Up to 45 mN for Figure 3 calculations; 35 mN externally applied load for Figure 4 contact/wetted-area maps. Other imaging and stiffness experiments used separate load ranges. |
| Surface input | AFM measurements; 10 × 10 µm roughness scans and separate 60 × 60 µm contact-imaging scan. Sq = 4.7–99.3 nm. |
| Material properties | Supplementary Table SI: silicon nitride E = 205 GPa, ν = 0.25, H = 23 GPa; sapphire E = 335 GPa, ν = 0.25, H = 20 GPa. |
| Contact model | Elastoplastic BEM half-space model; strain hardening neglected; hardness-limited pressure. |
| Numerical settings | Final solver grid, convergence tolerances and software version: not reported in the accessible source. |
| Main TriboSolver outputs | Contact distribution, real contact area and interfacial gap map; force/area gives mean contact pressure. |
| Downstream calculation | Gap threshold for capillary-wetted area; Laplace pressure times that area for adhesion; separate load-balance interpretation of measured friction. |
From a gap map to capillary adhesion
The researchers identified small, finite gaps that could accommodate condensed water. Their equilibrium range was the thickness of two adsorbed water layers plus a critical condensation distance. Values taken from the literature gave approximately 2.8–4.8 nm over 20–50% relative humidity. The water-film data came from silicon oxide surfaces, an explicit assumption when interpreting this different material pair.
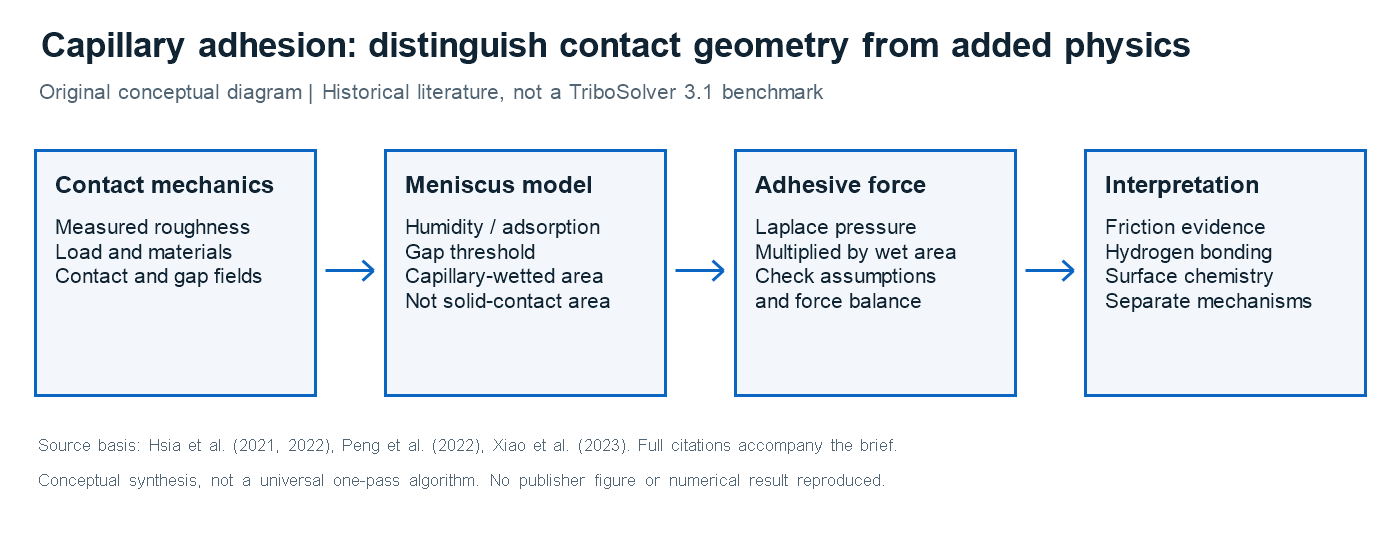
Water bridges have a curved water–air boundary. Its curvature produces a pressure difference, called Laplace pressure, which can attract the solids. The authors used water surface tension, an out-of-plane meniscus radius and a Tolman correction for small-scale curvature. Multiplying the pressure magnitude by the wetted area gave the adhesive force. This step was an additional author model applied to the contact geometry.
Adhesion adds to the externally applied load: repulsive solid-contact force balances both contributions. The authors therefore interpreted a rise in friction through the ratio of adhesive force to external force, using the roughest sphere’s measured friction coefficient as a baseline. This is not a friction coefficient predicted from geometry alone. It combines calculated geometry, liquid properties and an experimental reference.
Main findings
At the same normal force, the smoothest sphere had approximately four times the real contact area of the roughest sphere. Yet the overall friction-coefficient variation was only about 20%. Increasing area reduced mean pressure, while the inferred mean shear stress changed with normal stress. More contact area therefore did not translate into a proportional increase in friction.
The capillary model gave adhesive-force ranges of 3.9–14.5 mN for the smoothest interface, compared with 0.03–0.2 mN for the roughest over the stated humidity range. The force is associated with the grey wetted regions, not the red solid-contact regions. When the authors immersed the interface in water, removing the water–air menisci, the roughness dependence of friction disappeared. That experiment supported the capillary interpretation.
What TriboSolver contributed—and what it did not
TriboSolver contributed: mechanical contact and gap fields derived from measured topography, load and material properties.
Additional author model: equilibrium condensation, wetted-area estimation, Laplace adhesion and a friction interpretation referenced to measured behavior.
Not demonstrated: universal humidity-dependent friction, molecular hydrogen-bond kinetics, corrosion chemistry or a current-product feature that automatically reproduces the entire workflow.
The capillary calculation neglected other adhesion terms and assumed equilibrium remained relevant during slow sliding. Surface chemistry, contact angle, unmeasured small-scale roughness and softer materials can change the response. Hydrogen bonding and corrosion-induced hydrophilicity are distinct mechanisms; neither should be relabelled as a calculated gap or assumed to follow directly from this experiment.
Practical applications and conclusion
This workflow could help investigate precision contacts whose behavior changes after polishing or with environmental humidity. A useful sequence is to characterize both surfaces, compare calculated and observed contact, estimate the area eligible for a particular interaction and test the proposed mechanism independently. MEMS or positioning applications would require their own material and environmental evidence.
The study’s lesson is to keep three quantities separate: real contact area, capillary-wetted area and measured friction. TriboSolver’s earlier generation supplied the contact geometry. The researchers supplied the water model and experimental tests that made a physical interpretation possible. Smoothness was not a universal route to lower friction in this stiff, hydrophilic contact.
Reference and software links
Feng-Chun Hsia, Steve Franklin, Pierre Audebert, Albert M. Brouwer, Daniel Bonn and Bart Weber. “Rougher is more slippery: How adhesive friction decreases with increasing surface roughness due to the suppression of capillary adhesion.” Physical Review Research 3, 043204 (2021). Canonical publication · Open-access paper · Supplementary data.
Explore TriboSolver for rough-contact analysis, discuss your application, or read the related ice-friction application note.