

Optical Contact Measurements: What TriboSolver Helped Compare and Calibrate
Seeing where two rough surfaces carry their load
Two objects can appear to touch across a broad patch while their load is actually carried by many much smaller regions. Knowing their combined area is useful, but it does not reveal how unevenly the pressure is distributed. Two interfaces with similar contact areas can contain very different local concentrations of stress.
This is a measurement problem as well as a modelling problem. The interface is hidden between the solids, and an optical image does not automatically provide pressure in megapascals. A bright pixel may indicate contact, a molecular response, background light or a mixture of several unresolved features. Turning that image into a pressure map requires an explicit calibration.
Hsu and colleagues explored this problem in a 2024 study using fluorescent molecules attached to glass. Their molecular design made the optical response sensitive to compression. TriboSolver calculations supplied the contact-area and pressure fields used for comparison and calibration. The two roles are related, but must not be mistaken for the same validation claim.
The investigated system
The authors pressed a rough poly(methyl methacrylate), or PMMA, bead against a glass surface carrying chemically anchored probe molecules. A rheometer measured the normal force, while an inverted fluorescence microscope imaged the interface. The molecular layer was linked to the glass rather than freely distributed through the polymer.
The probe’s ground-state structure was twisted. Compression could make it more planar, changing its absorption and therefore the fluorescence detected under suitable illumination. A comparison molecule that was already relatively planar did not provide the same contact contrast. Separate spectroscopy and molecular calculations investigated why this design responded to pressure.
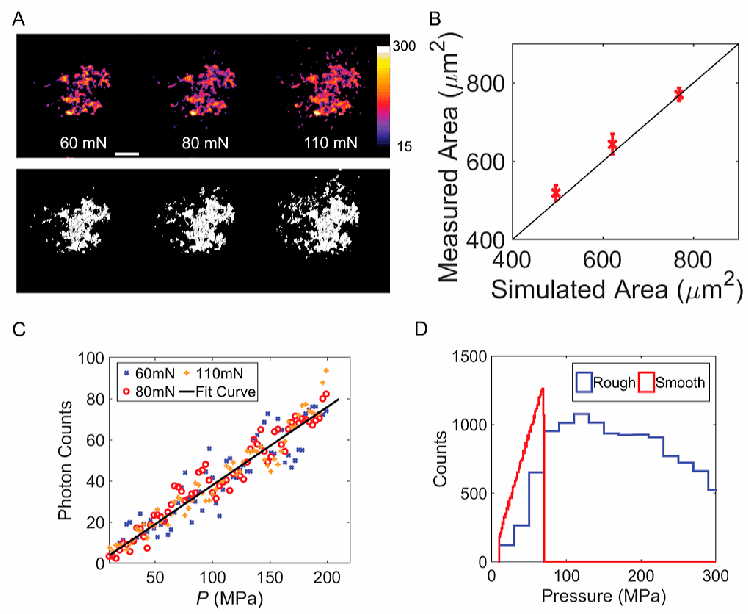
For the Figure 5 contact comparison, the authors increased normal force from 60 to 110 mN. Before loading, they measured topography at the location that would contact the glass, using an optical profilometer. This was a different bead from that used in the earlier Figures 2 and 3. Combining their conditions into one nominal experiment would therefore be misleading.
Why numerical contact mechanics was needed
The microscope measured photon counts. It could delineate contact regions, but it did not contain an independent pressure sensor at every pixel. A mechanical calculation using the measured bead surface supplied a spatial pressure estimate. That estimate made it possible to test whether brighter regions systematically corresponded to higher simulated pressure.
Using the actual contacting region mattered. A generic rough surface with the same roughness statistic would not place its asperities at the same positions as the experimental image. Matching the geometry allowed corresponding features to be compared rather than merely comparing two unrelated-looking maps.
How TriboSolver was used
The paper explicitly names TriboSolver and cites its Tribology.eu home page in reference 50. The authors performed a boundary element method (BEM) contact calculation to obtain real contact area and the pressure profile from measured topography. They describe the growing contact area with load in terms of elastoplasticity.
| Model element | Information used in the study |
|---|---|
| Contact bodies | Rough PMMA bead against glass bearing surface-immobilized fluorescent probes. |
| Geometry | Bead-on-flat contact. Exact Figure 5 bead dimensions are assigned to supplementary Table S2, not verified in this review. |
| Normal load | 60–110 mN for the Figure 5 comparison. |
| Surface input | Optical profilometry at the actual region subsequently brought into contact; topography shown in Figure S6. |
| Material properties | Input values are in supplementary Table S2. That file could not be retrieved during this review; values are not substituted from a different PMMA study. |
| Contact model | BEM calculation with elastoplastic contact behavior. Exact hardness treatment and half-space implementation are not established by the accessible main text alone. |
| Numerical settings | Final grid, resolution changes, tolerances and exact software build remain unverified. |
| Main TriboSolver outputs | Contact pattern, real contact area and local contact-pressure field. |
| Downstream calculation | Background subtraction, feature registration, grouping by 3 MPa pressure intervals and averaging measured fluorescence to construct a pressure calibration. |
This table deliberately separates a parameter-retrieval gap from a claim that the authors omitted the parameter. The main paper directs readers to supporting information. An exact reconstruction should wait for that file and the original measurement data, not use typical handbook values in their place.
From an optical image to a pressure calibration
First, the researchers identified contact area from fluorescence using Otsu thresholding, an image-analysis method for separating intensity populations. They compared those areas with the BEM areas at the same forces. The contact patterns and their growth with load showed close agreement in the reported comparison.
Second, they subtracted the fluorescence background and aligned experimental and simulated features. They grouped pixels according to calculated pressure in 3 MPa intervals, then averaged measured intensity for each group. Across the tested forces, intensity and calculated pressure followed an approximately linear relationship.
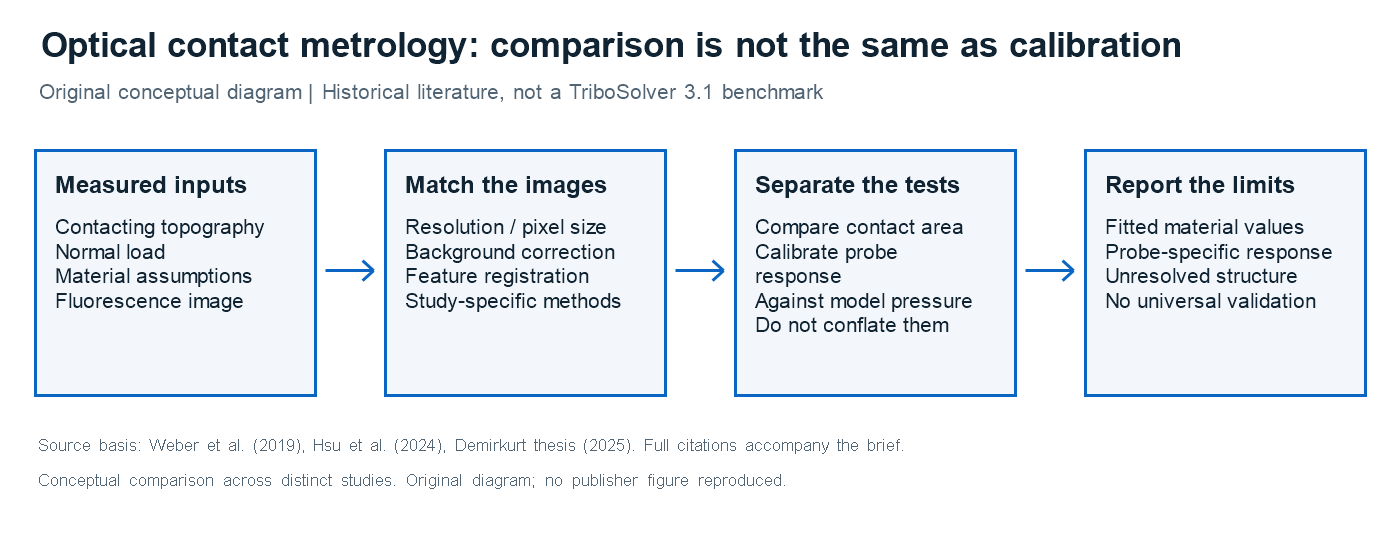
The distinction is crucial: pressure supplied the calibration axis. After calibration, the fluorescence image can be expressed as a pressure map, but that map is not an independent reference against which the same pressure calculation has been blindly tested. Agreement in contact area is a separate, useful observation; it does not eliminate assumptions in the pressure field.
Main findings
At 110 mN, the paper reports a pressure distribution extending approximately from 0 to 300 MPa for the rough contact, compared with 0 to 70 MPa for an ideal smooth-bead calculation under the same applied force. The rough interface concentrates load into fewer, smaller regions. These ranges belong to the study’s calibrated comparison, not a universal roughness multiplier.
The optical response also depended on illumination. The authors found maximum contact contrast near 470 nm for the planarizable probe. Separate hydrostatic-pressure and molecular calculations indicated that directional compression at the interface could affect molecular conformation differently from isotropic pressure in solution. TriboSolver did not perform those quantum-chemical calculations.
What TriboSolver contributed—and what it did not
TriboSolver contributed: contact-area and pressure estimates based on measured bead topography and mechanical inputs.
Additional author methods: probe synthesis, fluorescence imaging, spectroscopy, molecular calculations, image alignment and pressure-intensity calibration.
Not demonstrated: independent pixel-level pressure validation against an unrelated pressure standard, a universal optical calibration, or a complete prediction of friction onset.
Spatial resolution and registration remain important. A pixel can contain more than one physical feature, and a slight offset can pair a bright spot with the wrong calculated pressure. Binning improves interpretability but also averages local variation. A fitted or calibrated quantity should remain labelled as such when reporting the result.
Practical applications and conclusion
The workflow could be useful in experimental contact metrology, particularly when studying polymer contacts or the early stages of sliding. A careful investigation would first establish the probe response, measure the exact surface, compare areas and document the calibration before drawing conclusions about pressure-sensitive behavior. Different probes or materials require their own checks.
The study demonstrates a productive collaboration between computation and experiment. TriboSolver supplied a mechanical interpretation of the hidden interface; fluorescence supplied spatial information. Keeping calibration, measured contact area and simulated pressure distinct makes that collaboration stronger and prevents a visually convincing map from being mistaken for broader validation.
Reference and software links
Chao-Chun Hsu, Allen Chu-Hsiang Hsu, Chun-Yen Lin, Ken-Tsung Wong, Daniel Bonn and Albert M. Brouwer. “Molecular Probing of the Microscopic Pressure at Contact Interfaces.” Journal of the American Chemical Society 146, 13258–13265 (2024). Canonical publication · Open-access published paper.
Explore TriboSolver or discuss your contact-measurement application. This article describes published research, not a new current-release verification.